
Climate models depend on dynamics across a huge range of spatial and temporal scales. Resolving all scales that matter for climate–from the scales of cloud droplets to planetary circulations–will be impossible for the foreseeable future. Therefore, it remains critical to link what is unresolvable to variables resolved on the model grid scale. Parameterization schemes are a tool to bridge such scales; they provide simplified representations of the smallest scales by introducing new empirical parameters. An important source of uncertainty in climate projections comes from uncertainty about these parameters, in addition to uncertainties about the structure of the parameterization schemes themselves. For example, Suzuki et al. (2013) and Zhao et al. (2016) showed how different choices of parameters affecting cloud microphysics can drastically alter the response of climate models to increases in atmospheric greenhouse gas concentrations.
One form of data: high-resolution simulations
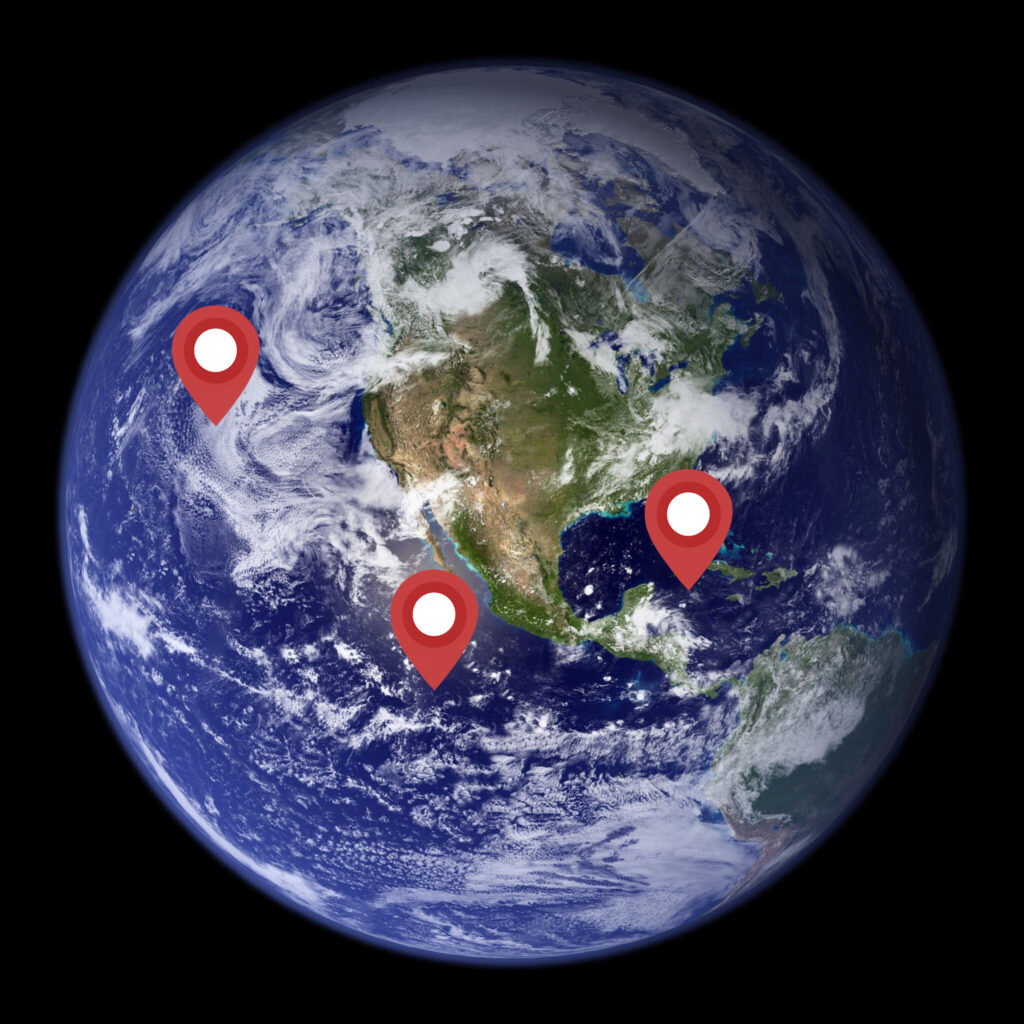
Data produced computationally, in high-resolution simulations over limited areas and time periods, can be used to calibrate parameterizations of processes that are in principle computable, but for which current computational capacities do not suffice to resolve them globally. Such processes include, for example, the turbulent and convective dynamics of clouds, for which we are continuing to expand a library of high-resolution simulations (Figure 1). This raises the question when and where to conduct such high-resolution simulations, for them to be maximally informative about the parameterized processes. (Similar questions of experimental design also arise in the choice of sites for observational field campaigns or in the design of new satellite missions.).
Not all data sites are created equal
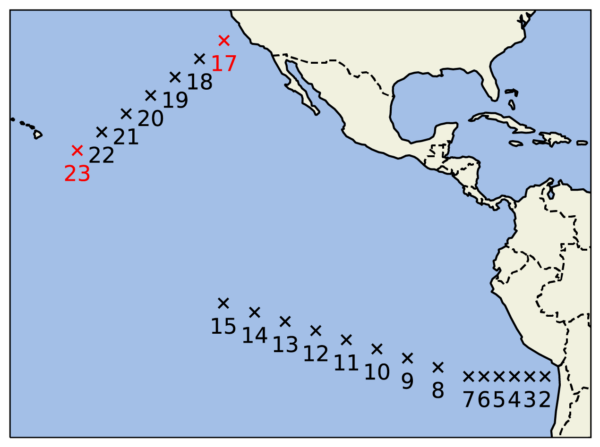
In Dunbar et al. (2022), we describe an algorithm that automates the optimal choice of sites for acquiring new data for calibration of parameterization schemes. We demonstrate the algorithm in a relatively simple proof-of-concept with an idealized general circulation model (GCM), developed by Frierson et al. (2006) and O’Gorman & Schneider (2008). The GCM has a convection scheme with two key parameters: a reference relative humidity and a convective relaxation time. To demonstrate the algorithm, we consider calibrating the two convection parameters by using the zonal- and time-mean model output statistics of the relative humidity in the mid-troposphere, the precipitation rate, and a measure of intense precipitation (Figure 2). We ask the question: suppose we can acquire data at only one latitude (the GCM is statistically zonally symmetric, so variations along longitude do not matter), which latitude is most informative about the convection parameters?
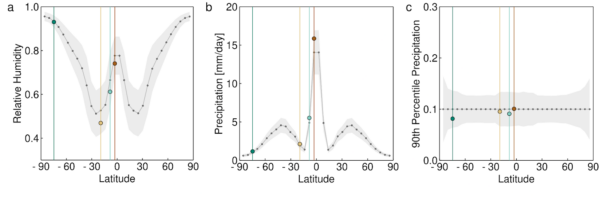
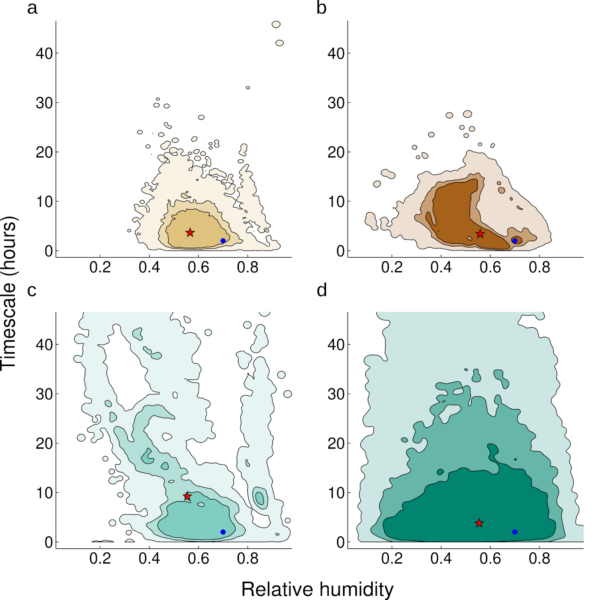
In Figure 2, four representative data samples for 4 latitudes are given in different colors. The resulting learnt joint distributions from calibrating convection parameters for each latitude are plotted in Figure 3. At the optimal latitude (-19°, colored yellow), around the subtropical precipitation minimum, the parameter distribution is well constrained; at the worst latitude (-75°, colored dark green) near the south pole, it is largely unconstrained (close to the prior distribution). As our aim is to reduce the uncertainty of calibrated parameters, the extent to which the posterior uncertainty of the constrained distributions is reduced from the prior indicates the information provided by data at a site.
A framework to automate decision making
To automate site selection for data acquisition so as to optimize the information gain, or uncertainty reduction, we devise an algorithm that maximizes an entropy-based measure of the utility of different sites. The algorithm builds on the calibrate-emulate-sample (CES) algorithm, which accelerates uncertainty quantification in complex computer models (open source code). The resulting algorithm is parallelizable and very efficient with respect to the number of model evaluations required to obtain optimal acquisition sites.
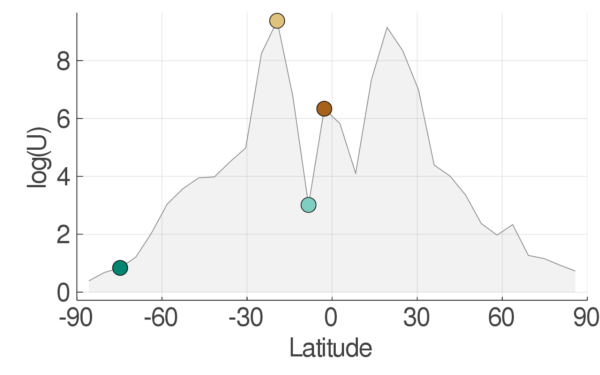
The utility the algorithm assigns to any given location (or time period) is based on a Bayesian analysis of the parameter learning problem for each site. The utility reflects the global model’s sensitivity to new data at each site, a good indicator of information gain. The site-dependent sensitivity to parameters can be calculated from the global model at any site without actually acquiring any data. As data acquisition may involve running a high-resolution simulation, being able to choose sites prior to this is advantageous. Applying the algorithm to the idealized GCM, we find that the utility function (Figure 4) indeed identifies the correct optimal latitude to acquire data (-19°, yellow disc). In our paper, we also show that the optimal site-season pairs for data acquisition can be determined similarly in a seasonally varying configuration of the GCM.
Beyond physical intuition
This simple experiment with an idealized GCM already indicates that making decisions guided only by physical intuition, in data limited problems, may not always lead to optimal choices. One intelligent guess, for example, would be that the optimal site to learn parameters for convection lies near the ITCZ, where convective tendencies are largest (Figure 2, 3, 4; latitude -3°, brown disc). However, this is not necessarily the case. In the example in Figure 2, it is in fact the region around the subtropical precipitation minimum (latitude -19°, yellow disc) that is most sensitive to changes in model parameters and hence is the most useful site for additional data acquisition–presumably because the intense convective precipitation events occurring there on occasion are particularly informative about parameters in the convection scheme
Accelerating the science workflow
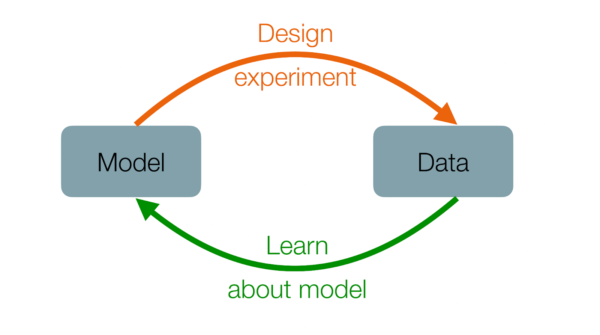
Our combined works (Dunbar et al. 2021, Dunbar et al. 2022, Howland et al. 2021, Shen et al. 2022) take steps toward automation of both (1) targeting data acquisition to optimize reduction of uncertainty in model parameters and (2) calibrating models and quantifying their uncertainties with the so-acquired data. These two stages form the scientific discovery loop (Figure 5). With a fully automated workflow in place, the loop can be iterated rapidly, perhaps thousands or tens of thousands of times in the case of learning about parameterizations in a climate model from high-resolution simulations. This can lead to rapid improvements in reducing parametric uncertainties in future climate models. Similar automated workflows are now becoming possible in many fields of science and engineering, as outlined in a recent report by the National Academies.