
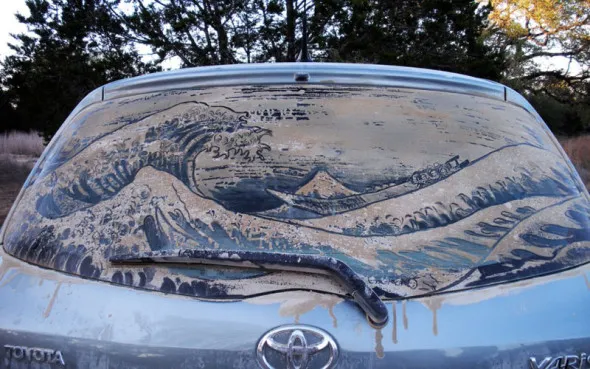
Part 10 of our tour of the CliMA software stack. The series began with why we built a new Earth system model; last week covered a land model that learns from data. No matter how fast you drive, the fine dust on your car will stay put. Air is viscous, and a viscous fluid sticks to a solid surface: right at the surface, the air moves with the car. This is the no-slip boundary condition of the Navier–Stokes equations. Even at 160 km/h (100 mph), the air within a fraction of a millimeter of the car’s finish is nearly at…
Read More

Blog
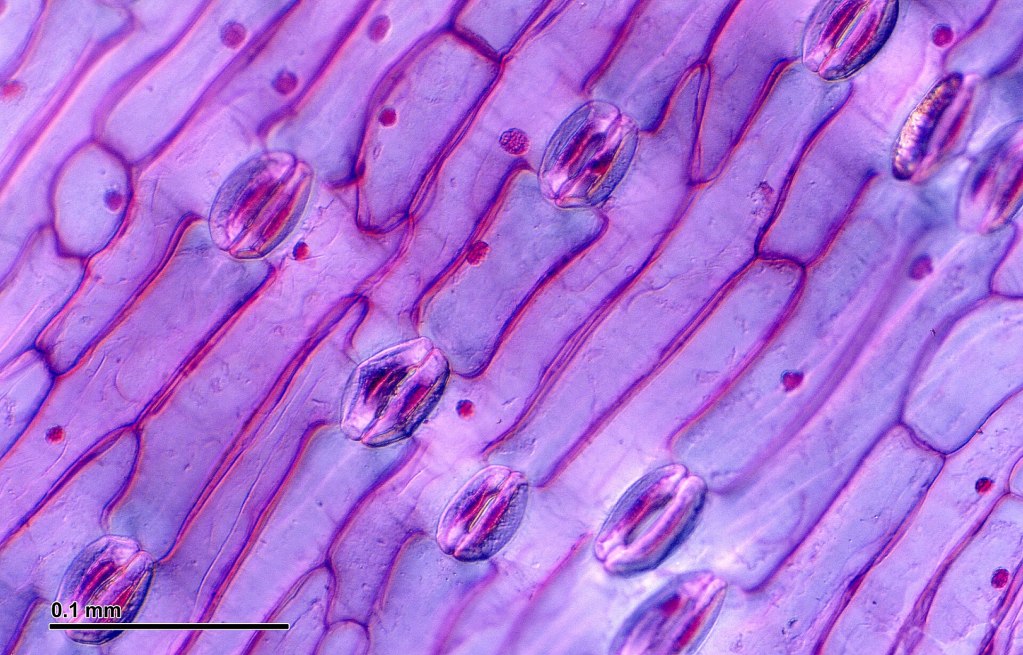
By Alexandre A. Renchon and Katherine Deck Part 9 of our tour of the CliMA software stack. The series began with why we built a new Earth system model. Two weeks ago we covered how we put a planet on a grid; last week’s post was an intermezzo on AI and understanding in science. About 40% of the rain that falls on land returns to the atmosphere after passing through the leaves of plants, in a process called transpiration. Plants transpire through their stomata, small openings on their leaves through which they also absorb CO2 for photosynthesis; stomata in a…
Read More
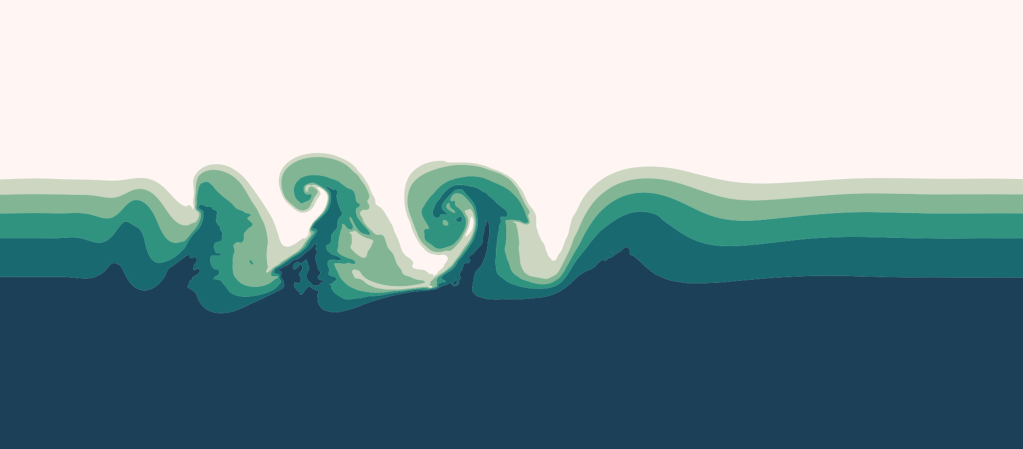
[This post was prompted by the recent discussions about the Navier-Stokes Millennium Prize problem and is cross-posted from Terry Tao’s blog. It lays out the reasoning behind how we use AI at CliMA.] The apparent proof of finite-time blow-up of the forced Navier-Stokes equation, announced by OpenAI on September 8, has brought into focus a debate about the role of AI in mathematics. The proof was produced with a system of some 10,000 AI agents that explored many approaches in parallel; it was then formalized and verified in Lean. The formal verification supports its correctness, but mathematicians are still working…
Read More
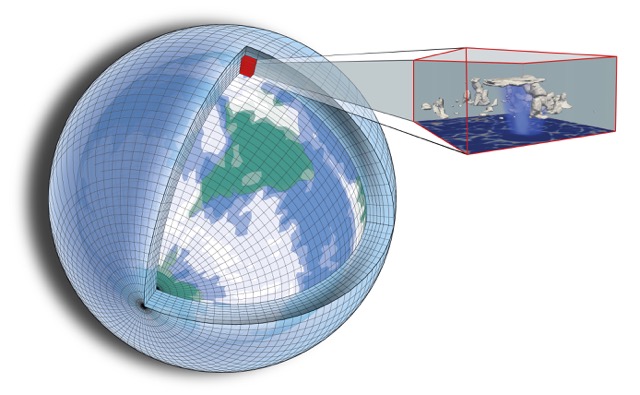
Part 8 of our tour of the CliMA software stack. The series began with why we built a new Earth system model; last week covered how we learn a climate model’s parameters from data. Simulating a physical system in space and time requires a discretization: a grid in four-dimensional space-time, on whose nodes we predict, in the case of the atmosphere, temperatures, winds, humidity, rainfall, and other variables. CliMA’s discretization is split across two packages. ClimaCore.jl handles space; ClimaTimeSteppers.jl handles time. Four requirements shaped their design: The globe must be tiled into elements of roughly equal size, so that all…
Read More
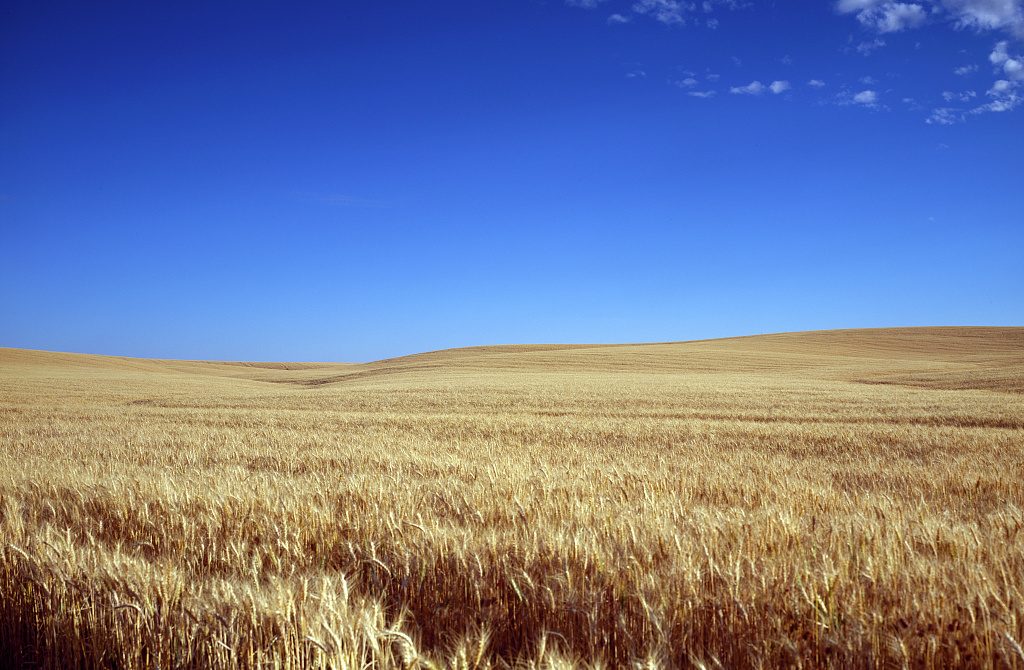
By Nat Efrat-Henrici and Tapio Schneider. Part 7 of our tour of the CliMA software stack. The series began with why we built a new Earth system model; last week covered how to calibrate a model of a chaotic system. In the summer of 1968, a field campaign measured wind profiles over a field of wheat stubble in Kansas. Functional forms were fitted to those measured profiles, including a coefficient that sets how strongly stable temperature stratification damps turbulence near the ground. The fitted profiles with the coefficient, 4.7, have since been used to represent stable boundary layers in models…
Read More

Part 6 of our tour of the CliMA software stack. The series began with why we built a new Earth system model; last week covered how cloud droplets grow up to become raindrops. Climate models such as CliMA’s contain hundreds of adjustable parameters that shape the behavior of a simulation. They increase a model’s expressiveness where process understanding is incomplete, and they range from physically interpretable parameters in process models to the weights and biases of embedded machine learning (ML) models, all calibrated so that the model is as consistent with observed data as possible. But the climate system is…
Read More

Part 5 of our tour of the CliMA software stack. The series began with why we built a new Earth system model; last week covered radiative transfer, a Nobel-winning calculation, runnable in minutes. The total water vapor in Earth’s atmosphere, if it all rained out, would cover the globe with a liquid layer on average only about 22 mm (less than an inch) deep. We cannot see this water vapor in the air. It only becomes visible once it condenses into liquid droplets or ice crystals. Whenever we see a white cumulus cloud on a summer day, a thunderstorm anvil…
Read More
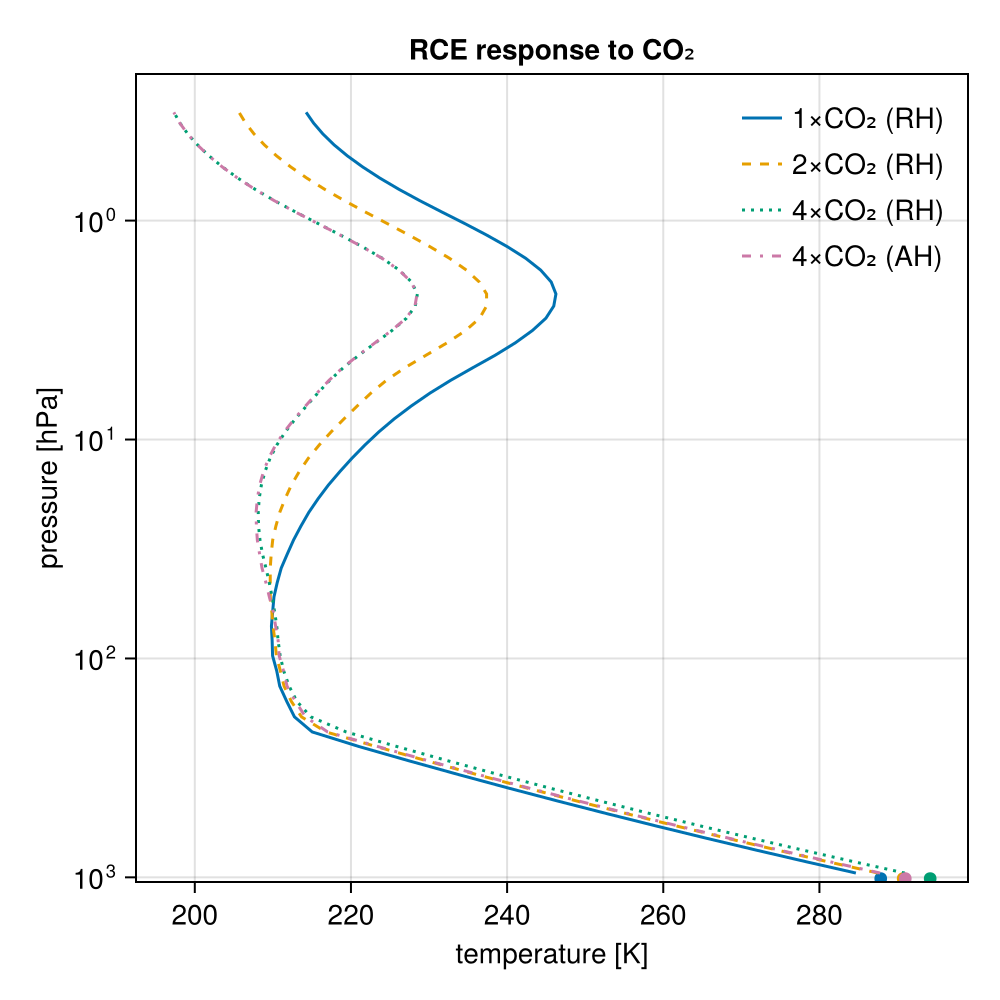
By Zhaoyi Shen and Tapio Schneider. Part 4 of our tour of the CliMA software stack. The series began with why we built a new Earth system model; last week covered methane rain on Titan and the thermodynamics of moist air. Water vapor is the most important greenhouse gas on Earth. Removing all water vapor from an atmospheric column in a one-dimensional climate model cools the surface by 24 K, to well below freezing; removing the CO2 instead cools the surface by 17 K. Yet we do not track water vapor emissions, because water vapor provides a feedback, not a…
Read More
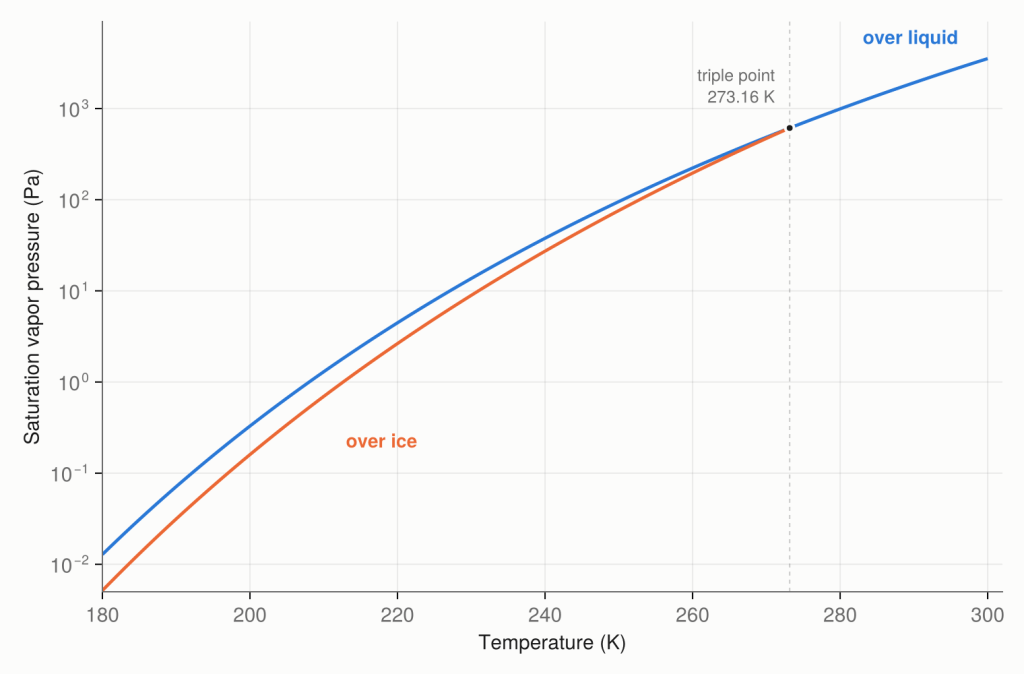
Part 3 of our tour of the CliMA software stack. The series began with why we built a new Earth system model; last week covered sunlight and the pace of ice ages. On Saturn’s moon Titan, it rains. The drops are liquid methane, a centimeter across, and they drift down through the thick atmosphere more slowly than snowflakes fall on Earth. The rains return to each pole during the Titan summer—which comes around every 30 Earth years—and they fill lakes of liquid methane in the polar regions, creating the only standing bodies of surface liquid in the solar system besides…
Read More
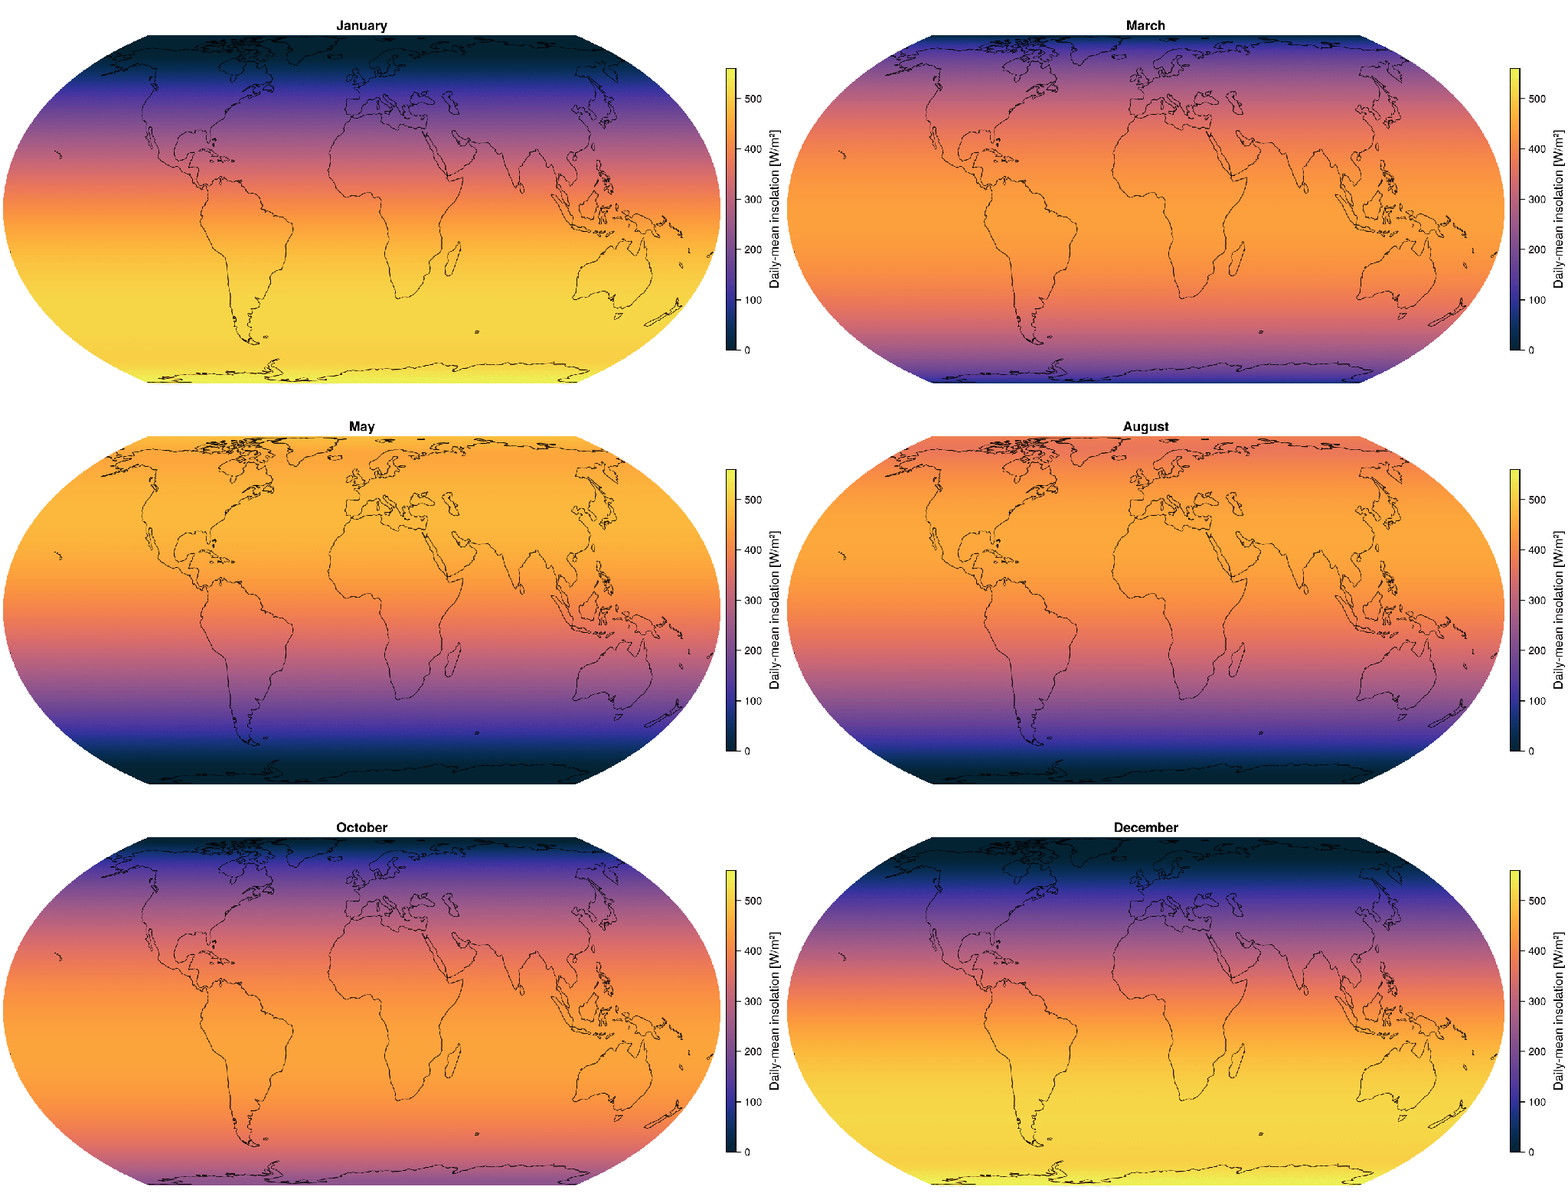
By Julian Schmitt and Tapio Schneider Everything in the climate system begins with sunlight. Weather, ocean currents, and the growth of forests are all powered by solar radiation entering at the top of the atmosphere. The amount arriving at any particular place and time is the insolation: the solar power passing through a unit area tangential to the top of the atmosphere. Insolation is a function of the solar radiative energy flux, which varies with the Earth–Sun distance, and the elevation of the Sun in the sky, which varies with location, time of day, and time of year. Aside from…
Read More